7 Proven Secrets of Steady-State Concentration (Css): Master Pharmacokinetics, Accurate Dosing & Safer Patient Care Today
Steady-State Concentration (Css): A Comprehensive Guide to Pharmacokinetic Principles, Clinical Applications, and Therapeutic Drug Monitoring for Modern Healthcare Practice
Introduction: The Bathtub Analogy That Every Clinician Should Understand
Imagine you are standing beside a bathtub. The tap is turned on, and water begins flowing into the tub at a constant rate. Simultaneously, there is a drain at the bottom that is partially open, allowing water to escape. At first, the water level rises quickly because the rate of water entering far exceeds the rate leaving. As the water level increases, however, the pressure at the bottom of the tub rises, pushing more water through the drain each minute. Eventually, you reach a point where the amount of water entering the tub each minute exactly equals the amount leaving through the drain. At this moment, the water level stops rising and remains constant. You have reached a steady state.
This bathtub analogy captures the fundamental principle behind one of the most important concepts in clinical pharmacology: steady-state concentration, commonly abbreviated as Css. The bathtub represents the human body, the flowing tap represents drug administration, the drain represents drug elimination through metabolism and excretion, and the water level represents the concentration of drug in the plasma. Just as the bathtub eventually reaches a stable water level when input equals output, the human body reaches a plateau in drug concentration when the rate of drug administration equals the rate of drug elimination.
Now consider a seventy-two-year-old man admitted to the medical ward with methicillin-resistant Staphylococcus aureus bacteremia. His infectious disease consultant has prescribed intravenous vancomycin. The clinical pharmacist calculates an appropriate loading dose followed by a maintenance regimen based on the patient’s actual body weight and estimated creatinine clearance. After starting therapy, the team draws vancomycin trough levels before the fourth dose. The question every clinician on that team should be able to answer is this: why wait until the fourth dose? The answer lies in understanding steady-state pharmacokinetics, the time required to achieve stable drug concentrations, and the critical distinction between therapeutic levels drawn at steady state versus those drawn during the accumulation phase.
This article will take you on a comprehensive journey through the science and clinical application of steady-state concentration. We will build this understanding layer by layer, starting with fundamental pharmacokinetic principles, progressing through mathematical formulas and their clinical interpretation, and ultimately arriving at practical applications in therapeutic drug monitoring, dose individualization, and the management of special patient populations. Whether you are a medical student encountering these concepts for the first time or an experienced clinician seeking a deeper understanding of the pharmacological principles that guide daily prescribing decisions, this resource aims to provide clarity, depth, and clinical relevance.
Chapter 1: Defining Steady-State Concentration — The Foundation of Rational Pharmacotherapy
What Exactly Is Steady-State Concentration?
Steady-state concentration refers to the plateau in drug plasma concentration that is achieved when the rate of drug administration into the systemic circulation equals the rate of drug elimination from the body. At steady state, the average plasma concentration remains constant over time, assuming that dosing continues unchanged and that the pharmacokinetic parameters of the drug, including clearance and volume of distribution, remain stable. The term steady state does not imply that drug concentrations are absolutely unchanging from moment to moment. With intermittent oral or intravenous bolus dosing, concentrations will still fluctuate between peak levels shortly after administration and trough levels just before the next dose. What remains constant at steady state is the average concentration over each dosing interval, as well as the reproducible peak and trough patterns from one interval to the next.
To fully appreciate this definition, it is helpful to understand that the human body is an open system. Drugs enter through various routes of administration, distribute throughout various tissues and fluid compartments, and are eventually removed through metabolic biotransformation, primarily in the liver, or through excretory pathways, most importantly the kidneys. When drug administration begins, plasma concentrations rise because input exceeds output. As concentrations climb, elimination rates increase proportionally for drugs that follow first-order kinetics, which describes the behavior of the vast majority of medications used in clinical practice. Eventually, the elimination rate catches up to the administration rate, and a dynamic equilibrium is established. At this point, the amount of drug entering the body during each dosing interval exactly replaces the amount eliminated during that same interval. The plasma concentration averaged over the interval has reached its target and will not change with continued dosing unless one of the pharmacokinetic variables changes.
The Pharmacokinetic Basis: Input Must Equal Output
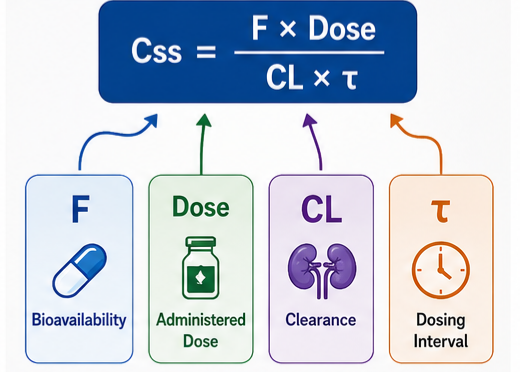
The scientific foundation of steady state rests on the principle of mass balance. If we denote the rate of drug administration as the dose divided by the dosing interval, and we account for bioavailability in the case of orally administered drugs, then the input rate can be expressed as (F × Dose) / τ, where F represents bioavailability and τ represents the dosing interval. The elimination rate, assuming first-order kinetics, is given by CL × Css, where CL represents total body clearance and Css represents the average steady-state concentration. At steady state, these two rates become equal:
(F × Dose) / τ = CL × Css
Rearranging this equation yields the clinically useful expression:
Css = (F × Dose) / (CL × τ)
This formula tells the prescriber exactly how the steady-state concentration depends on four variables: the dose administered, the fraction of that dose that reaches the systemic circulation, the body’s ability to clear the drug, and the frequency of dosing. Double the dose while keeping everything else constant, and the Css will approximately double. Reduce a patient’s clearance by half through renal impairment, and the Css will also double if the dose and interval remain unchanged. This proportional relationship between dose rate and concentration is a hallmark of linear pharmacokinetics and underpins most clinical dosing adjustments.
Expand your Islamic knowledge with authentic articles on the Qur’an, Hadith, Prophets, Islamic History, and more. قرآن، حدیث، انبیاء کرامؑ، اسلامی تاریخ اور دیگر مستند اسلامی معلومات ایک ہی جگہ دریافت کریں۔ ssthem.com
Chapter 2: Why Steady State Matters in Clinical Medicine
The Therapeutic Window and the Goal of Dosing
Every drug with systemic effects has a therapeutic window, a range of plasma concentrations within which the desired pharmacological effect is likely to occur without unacceptable toxicity. Below this window, the drug concentration is insufficient to produce a clinically meaningful response, leaving the patient inadequately treated. Above this window, the risk of adverse effects escalates, sometimes with life-threatening consequences. The goal of any rational dosing regimen is to achieve and maintain plasma concentrations within this therapeutic window throughout the course of treatment.
Steady-state concentration is the parameter that determines whether a given dosing regimen achieves this goal. The average Css should ideally fall within the therapeutic range. Moreover, for drugs with narrow therapeutic indices, such as digoxin, lithium, aminoglycoside antibiotics, and certain antiepileptic agents, the peak and trough fluctuations around the average Css must also remain within safe boundaries. A dosing interval that is too long relative to the drug’s half-life can produce peaks that reach toxic levels and troughs that fall below the minimum effective concentration, even if the average Css appears appropriate.
Prevention of Subtherapeutic Dosing and Treatment Failure
One of the most common consequences of misunderstanding steady-state kinetics is the premature assessment of a drug’s efficacy. Consider a patient started on oral amiodarone for atrial fibrillation. Amiodarone has an extraordinarily long and variable half-life, ranging from approximately twenty-five days to over one hundred days. Steady state may not be reached for several months. A clinician who evaluates the antiarrhythmic effect after only two weeks and concludes that the drug is ineffective may inappropriately escalate the dose or abandon amiodarone in favor of an alternative agent. In reality, the drug has simply not had sufficient time to accumulate to its target steady-state concentration. Recognizing the relationship between half-life and time to steady state prevents such premature therapeutic judgments.
The same principle applies in reverse when discontinuing drugs. A patient who develops a suspected adverse effect from a drug with a long half-life will not experience prompt relief simply by stopping the medication. The body requires the same five half-lives to eliminate the drug that it required to accumulate it. Understanding this prevents unnecessary interventions for persistent drug effects that will resolve as concentrations naturally decline.
Avoidance of Toxicity Through Timely Monitoring
Equally important is the prevention of drug toxicity through appropriately timed therapeutic drug monitoring. Drawing drug levels too early, before steady state has been reached, will yield concentrations lower than those that will eventually prevail. If the clinician mistakenly interprets these pre-steady-state levels as representative of the final drug exposure and increases the dose in response, the patient may ultimately experience toxic concentrations once accumulation is complete. This scenario is particularly hazardous with drugs like digoxin or lithium, where the gap between therapeutic and toxic levels is narrow, and the consequences of toxicity can include life-threatening arrhythmias, neurological catastrophe, or permanent renal damage.
The standard clinical practice of checking vancomycin trough levels before the fourth dose in patients with stable renal function is grounded precisely in steady-state principles. Vancomycin has a half-life of approximately six to eight hours in patients with normal kidney function. Four dosing intervals of twelve hours each spans approximately forty-eight hours, which represents roughly five to six half-lives. By this point, the patient has achieved over ninety-five percent of the eventual steady-state concentration, and the measured trough level reliably reflects the drug exposure the patient will experience if the regimen continues unchanged.
Chapter 3: The Pharmacokinetic Principles Underlying Steady State
Drug Input: Routes, Rates, and Bioavailability
The journey of a drug from the site of administration to the systemic circulation involves processes that determine both the rate and the extent of absorption. Intravenous administration bypasses absorption entirely, delivering the entire dose directly into the bloodstream with one hundred percent bioavailability. Oral administration, by contrast, subjects the drug to dissolution in gastrointestinal fluids, permeation across the intestinal epithelium, and first-pass metabolism in the liver before reaching the systemic circulation. The fraction of the administered dose that survives this journey is the drug’s oral bioavailability, designated as F in pharmacokinetic equations.
The rate of absorption influences the shape of the plasma concentration-time curve but does not affect the average steady-state concentration achieved with repeated dosing. Whether a drug is absorbed rapidly, producing sharp peaks, or slowly, producing flatter profiles, the average concentration at steady state depends only on the total amount of drug reaching the systemic circulation over time and the body’s capacity to eliminate it. This is a clinically important point: extended-release formulations, which slow the rate of absorption, reduce peak-to-trough fluctuations but do not alter the average Css compared with immediate-release formulations given at the same total daily dose.
Drug Elimination: Clearance and Half-Life
Clearance is arguably the most important pharmacokinetic parameter in clinical medicine. It quantifies the volume of plasma from which a drug is completely removed per unit of time and is typically expressed in liters per hour or milliliters per minute. Total body clearance represents the sum of all clearance pathways, including hepatic metabolism, renal excretion, and any other routes such as biliary secretion or pulmonary elimination. A drug with a high clearance is efficiently removed from the body, and higher doses or more frequent administration are required to maintain therapeutic concentrations. A drug with low clearance accumulates more readily and requires lower doses.
Half-life, designated as t½, is the time required for the plasma concentration of a drug to decrease by fifty percent during the elimination phase. Half-life is not an independent parameter; it is mathematically derived from clearance and volume of distribution according to the relationship:
t½ = (0.693 × Vd) / CL
Volume of distribution (Vd) is a proportionality constant that relates the total amount of drug in the body to the plasma concentration. A drug that distributes extensively into tissues will have a large Vd and, for a given clearance, a longer half-life. A drug that remains largely confined to the vascular compartment will have a smaller Vd and a shorter half-life.
The half-life is the critical determinant of how long it takes to reach steady state and how long it takes for a drug to be eliminated after discontinuation. This relationship is independent of dose, dosing frequency, or route of administration.
Chapter 4: How Steady State Is Achieved — The Accumulation Process
The Mathematics of Accumulation
When a patient begins a new medication regimen involving repeated doses, the plasma concentration does not immediately jump to its final plateau. Instead, it climbs gradually, with each successive dose adding to the residual drug remaining from previous doses. This process is known as drug accumulation, and it follows a predictable pattern governed by the elimination half-life.
During the first dosing interval, the concentration rises from zero to some peak, then declines according to first-order elimination kinetics. At the end of the interval, a certain residual concentration remains before the second dose is administered. The second dose then adds to this residual level, producing a peak higher than the first, and the subsequent decline again leaves a higher residual at the end of the interval. With each successive dose, the peak and trough levels rise incrementally, but each increment is smaller than the one before. This pattern of diminishing increments reflects the fact that as the concentration rises, the absolute amount of drug eliminated per unit time also rises, inching closer to the amount administered per unit time.
The Rule of Five Half-Lives
The approach to steady state follows an exponential curve. After one half-life, the plasma concentration has reached fifty percent of its eventual steady-state value. After two half-lives, approximately seventy-five percent has been reached. After three half-lives, the figure is approximately eighty-seven and a half percent. Four half-lives bring the concentration to about ninety-three and three-quarters percent of steady state. By five half-lives, approximately ninety-seven percent of the final steady-state concentration has been achieved. For most clinical purposes, five half-lives is considered the point at which steady state has been practically attained.
It is essential to recognize that these percentages apply regardless of the dosing regimen, the drug, or the patient. Whether the half-life is six minutes or six weeks, five half-lives will always bring the patient to within approximately ninety-seven percent of steady state. The clinical implication is that drugs with long half-lives require prolonged periods before stable concentrations are achieved. Conversely, drugs with very short half-lives reach steady state rapidly and are also cleared rapidly when discontinued.
Continuous Infusion Versus Intermittent Dosing
With a continuous intravenous infusion, drug is delivered at a constant rate, and the plasma concentration rises smoothly along an exponential curve, asymptotically approaching the steady-state level without the peaks and troughs characteristic of intermittent dosing. The steady-state concentration during continuous infusion is perfectly constant, with no fluctuation whatsoever. This makes continuous infusion an attractive option for drugs with very short half-lives or narrow therapeutic indices, where large fluctuations from intermittent dosing could lead to toxicity at peaks or loss of effect at troughs.
With intermittent dosing, whether intravenous bolus or oral administration, the plasma concentration at steady state oscillates between a maximum concentration shortly after administration and a minimum concentration just before the next dose. The degree of fluctuation depends primarily on the dosing interval relative to the half-life. When the dosing interval is much shorter than the half-life, the fluctuations are small, and the concentration profile approaches that of a continuous infusion. When the dosing interval is long relative to the half-life, the fluctuations are substantial, and the drug may be nearly completely eliminated between doses.
Chapter 5: The Steady-State Concentration Formula and Its Clinical Interpretation
The Fundamental Equation
The average steady-state concentration achieved with a given maintenance regimen is described by the equation introduced earlier:
Css(avg) = (F × Dose) / (CL × τ)
Where Css(avg) is the average plasma concentration at steady state, F is the bioavailability fraction (ranging from zero to one), Dose is the amount of drug administered in each individual dose, CL is the total body clearance, and τ (tau) is the dosing interval. The quantity F × Dose represents the amount of drug actually reaching the systemic circulation from each dose. Dividing by τ converts this amount into a rate of drug input. Dividing by CL yields the concentration that results from that input rate.
Worked Example: Oral Digoxin
Consider a patient with heart failure and preserved renal function prescribed oral digoxin at a dose of 0.125 mg once daily. The oral bioavailability of standard digoxin tablets is approximately 0.7. The total body clearance of digoxin in a patient with normal renal function is roughly 7 L/hour. Applying the formula:
F × Dose = 0.7 × 0.125 mg = 0.0875 mg
τ = 24 hours
Rate of input = 0.0875 mg / 24 hours = 0.00365 mg/hour
Css(avg) = 0.00365 mg/hour ÷ 7 L/hour = 0.00052 mg/L = 0.52 ng/mL
This calculated concentration falls within the lower end of the generally accepted therapeutic range for digoxin in heart failure, which is typically 0.5 to 0.9 ng/mL. The clinician can use this calculation to predict whether a proposed dose is likely to achieve therapeutic levels and to guide dose adjustments if the observed concentration differs from the prediction.
Understanding the Variables: What Each Term Actually Means
Bioavailability deserves particular attention in clinical practice. For intravenously administered drugs, F equals one by definition, simplifying the equation to Css(avg) = Dose / (CL × τ). For orally administered drugs, F may vary considerably between patients due to differences in gastrointestinal motility, mucosal integrity, splanchnic blood flow, and the activity of intestinal and hepatic drug-metabolizing enzymes and transporters. Drugs with high first-pass metabolism, such as verapamil, propranolol, and morphine, have low and variable oral bioavailability, meaning that small changes in hepatic function can produce large changes in the amount of drug reaching the systemic circulation and, consequently, in Css.
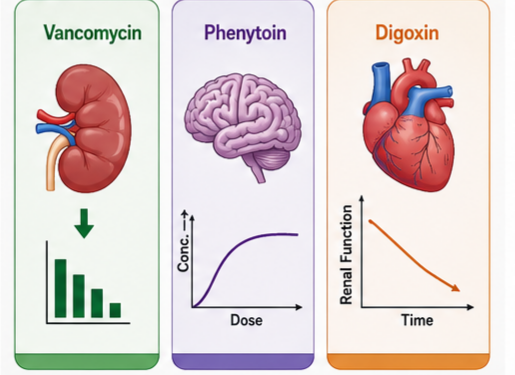
Clearance represents the body’s capacity to irreversibly remove drug from the plasma. For drugs eliminated primarily by the kidneys, such as vancomycin, aminoglycosides, and digoxin, clearance correlates closely with renal function, most commonly estimated through creatinine clearance or estimated glomerular filtration rate. For drugs eliminated primarily by hepatic metabolism, such as warfarin, phenytoin, and most benzodiazepines, clearance depends on hepatic blood flow, the activity of drug-metabolizing enzymes, and the extent of plasma protein binding. Disease states, drug interactions, and genetic polymorphisms affecting any of these factors will alter clearance and shift the achieved Css.
The dosing interval determines the frequency of drug administration and, together with the half-life, dictates the magnitude of peak-to-trough fluctuations. Shortening the interval while keeping the total daily dose constant reduces fluctuations but increases pill burden and may compromise adherence. Lengthening the interval increases fluctuations and may allow trough concentrations to fall below the minimum effective concentration for part of the dosing cycle. The art of designing a dosing regimen involves balancing these considerations to achieve safe and effective concentrations throughout the entire interval.
Chapter 6: The Relationship Between Half-Life and Time to Steady State — A Deeper Examination
The Exponential Mathematics of Accumulation and Elimination
The approach to steady state and the elimination of drug after discontinuation are governed by the same exponential mathematics. During drug accumulation, the fraction of steady state achieved after n half-lives is given by:
Fraction of Css = 1 − (1/2)^n
After one half-life, n equals one, and the fraction is 1 minus one-half, which equals 0.50. After two half-lives, 1 minus one-quarter equals 0.75. After three, 1 minus one-eighth equals 0.875. After four, 1 minus one-sixteenth equals 0.9375. After five, 1 minus one-thirty-second equals approximately 0.969. This is the origin of the clinical rule that steady state is effectively achieved after five half-lives.
The same equation describes drug elimination after cessation of therapy. The fraction of drug remaining after n half-lives is simply (1/2)^n. After five half-lives, approximately three percent of the drug remains, which for most clinical purposes is considered complete elimination.
Clinical Scenarios Where Time to Steady State Matters
The implications of this relationship extend across numerous clinical scenarios. A patient started on levothyroxine for hypothyroidism will require approximately four to five weeks to reach steady state because the half-life of thyroxine is about seven days. Thyroid function tests drawn after two weeks of therapy will not reflect the ultimate effect of that dose, and premature dose escalation based on these early results risks overtreatment and iatrogenic hyperthyroidism.
A patient initiated on fluoxetine for major depressive disorder will require four to five weeks to achieve steady-state concentrations of the parent drug, which has a half-life of four to six days, and considerably longer to reach steady state for the active metabolite norfluoxetine, whose half-life extends to four to sixteen days. The full therapeutic effect of the drug at a given dose cannot be assessed until steady state has been reached and maintained for an additional period required for downstream neuroadaptive changes.
In the inpatient setting, a critically ill patient started on a continuous infusion of unfractionated heparin will reach steady-state anticoagulant effect within hours because the half-life of heparin is approximately sixty to ninety minutes. Rapid achievement of steady state allows for prompt titration to therapeutic activated partial thromboplastin time targets, a critical advantage when managing life-threatening thromboembolic disease. The short half-life also means that if bleeding develops, discontinuing the infusion will lead to rapid reversal of anticoagulation, an important safety consideration.
Read evidence-based information about medicines, diseases, symptoms, and treatments ادویات، بیماریوں، علامات اور علاج سے متعلق مستند اور تحقیق پر مبنی معلومات حاصل کریں ssthem.org
Chapter 7: Factors That Influence Steady-State Concentration in Individual Patients
The Impact of Renal Function
The kidneys play a central role in the elimination of many clinically important drugs, including aminoglycosides, vancomycin, digoxin, lithium, and numerous beta-lactam antibiotics. Renal clearance of a drug depends on glomerular filtration, tubular secretion, and tubular reabsorption, with the net effect representing the sum of these processes. In patients with impaired renal function, clearance of renally eliminated drugs decreases, leading to higher steady-state concentrations if the dosing regimen remains unchanged. The magnitude of the increase is inversely proportional to the reduction in clearance. If creatinine clearance falls by fifty percent, the clearance of a drug that is entirely renally eliminated will also fall by approximately fifty percent, and the Css will double.
This relationship underscores the critical importance of estimating renal function before initiating therapy with renally cleared drugs. Commonly used estimation equations, including the Cockcroft-Gault equation and the Modification of Diet in Renal Disease (MDRD) equation, provide estimates of creatinine clearance or glomerular filtration rate that can guide initial dose selection. However, these equations have limitations, particularly in patients with extremes of body weight, unstable renal function, or reduced muscle mass. In such cases, direct measurement of glomerular filtration rate or therapeutic drug monitoring with dose individualization provides a more reliable approach.
Hepatic Metabolism and the Cytochrome P450 System
For drugs that undergo extensive hepatic metabolism, clearance depends on the functional capacity of the liver’s drug-metabolizing enzyme systems. The cytochrome P450 superfamily, particularly CYP3A4, CYP2D6, CYP2C9, CYP2C19, and CYP1A2, is responsible for the oxidative metabolism of a vast array of therapeutic agents. Clearance through these pathways can be influenced by genetic polymorphisms that produce poor metabolizers or ultrarapid metabolizers, by concomitant medications that induce or inhibit specific isoenzymes, and by liver disease that reduces the mass or function of hepatocytes.
A patient who is a CYP2D6 poor metabolizer will have markedly reduced clearance of drugs such as codeine, tramadol, metoprolol, and certain tricyclic antidepressants. If administered standard doses, this patient will achieve steady-state concentrations substantially higher than expected, placing them at increased risk for adverse effects. Conversely, a CYP2D6 ultrarapid metabolizer will clear these same drugs more quickly, potentially achieving subtherapeutic concentrations at standard doses. Pharmacogenetic testing, where available, can identify such patients prospectively and guide individualized dosing.
The phenomenon of enzyme induction has equally profound implications. Rifampin, a potent inducer of CYP3A4 and several other isoenzymes, can dramatically reduce the bioavailability and increase the clearance of coadministered drugs such as oral contraceptives, warfarin, and certain antiretroviral agents. The Css of the affected drug will decline over the course of days to weeks as the enzyme induction develops, potentially resulting in loss of therapeutic effect. Clinicians must anticipate these interactions, monitor drug levels where possible, and adjust doses accordingly.
Protein Binding and Its Clinical Relevance
Many drugs bind reversibly to plasma proteins, primarily albumin and alpha-1-acid glycoprotein. Only the unbound, or free, fraction of the drug is pharmacologically active and available for elimination and distribution into tissues. For drugs with low hepatic extraction ratios, protein binding restricts access to drug-metabolizing enzymes, and the total drug clearance is proportional to the unbound fraction. If the unbound fraction increases, as can occur in hypoalbuminemia due to liver disease, nephrotic syndrome, or malnutrition, total clearance of such drugs increases correspondingly. The total plasma concentration at steady state will decrease, but the unbound concentration, which is responsible for both therapeutic and toxic effects, will remain essentially unchanged.
This distinction between total and free drug concentrations is critical for interpreting therapeutic drug monitoring results. Most clinical laboratories measure total drug concentration. For highly protein-bound drugs such as phenytoin, valproic acid, and warfarin, the total concentration may be misleading in patients with altered protein binding. A patient with hypoalbuminemia may have a total phenytoin concentration that appears subtherapeutic, yet the free phenytoin concentration may be entirely adequate or even toxic. In such cases, measuring free drug levels or adjusting the target total concentration range based on the patient’s albumin level is essential for safe and effective therapy.
Age-Related Changes in Pharmacokinetics
Both extremes of age present unique challenges for achieving and maintaining appropriate steady-state concentrations. Neonates and infants have immature hepatic enzyme systems and reduced glomerular filtration rates relative to body size, resulting in reduced clearance of many drugs. Additionally, their higher proportion of total body water and lower fat mass alter volumes of distribution. Doses must be carefully adjusted based on weight or body surface area, and therapeutic drug monitoring becomes particularly important when available.
At the other end of the age spectrum, elderly patients experience progressive declines in renal function, reduced hepatic mass and blood flow, and changes in body composition that include increased fat mass and decreased lean body mass and total body water. Glomerular filtration rate declines by approximately one milliliter per minute per year after the age of forty, although this decline is highly variable between individuals. Serum creatinine alone is an unreliable marker of renal function in the elderly because the age-related decline in muscle mass reduces creatinine production. A serum creatinine that falls within the normal laboratory reference range may correspond to significantly impaired renal function in an elderly patient. Estimating creatinine clearance using equations that incorporate age, weight, and sex is essential for appropriate dose selection in this population.
Chapter 8: Drug Accumulation and the Accumulation Index
Quantifying Accumulation
The accumulation index, also referred to as the accumulation factor or accumulation ratio, quantifies the extent to which a drug accumulates in the body with repeated dosing relative to the concentration achieved after a single dose. It is defined as the ratio of the average concentration at steady state during a dosing interval to the average concentration during the first dosing interval. Mathematically, the accumulation index depends on the dosing interval and the elimination half-life.
For a drug administered at intervals equal to its half-life, the accumulation index is approximately two, meaning that the average concentration at steady state will be twice the average concentration achieved after the first dose. When the dosing interval is shorter than the half-life, accumulation is more pronounced because less drug is eliminated between doses. When the dosing interval is longer than the half-life, accumulation is minimal because most of the drug is eliminated before the next dose is administered.
Clinical Scenarios of Significant Accumulation
Digoxin, with its once-daily dosing and half-life of approximately thirty-six to forty-eight hours in patients with normal renal function, exhibits an accumulation index of approximately two to three. This means that the plasma concentrations observed after several weeks of therapy will be two to three times higher than those seen after the initial dose. A clinician who bases a dose increase on a digoxin level drawn after only a few days of therapy will almost certainly produce toxicity as accumulation proceeds to completion.
Amiodarone represents an extreme case of accumulation. With a half-life measured in weeks to months, the accumulation index with daily dosing is enormous. The drug accumulates extensively in adipose tissue and highly perfused organs, serving as a reservoir that continues to release drug into the circulation long after dosing has stopped. The time required to reach steady state can extend to six months or longer, and the antiarrhythmic effect and potential for toxicity evolve over a similarly prolonged timeframe. Understanding this accumulation profile prevents premature declarations of treatment failure and allows clinicians to counsel patients appropriately about the expected time course of both benefits and adverse effects.
Chapter 9: Maintenance Dose — The Cornerstone of Steady-State Therapy
The Maintenance Dose Concept
A maintenance dose is the dose administered at regular intervals to maintain the desired steady-state concentration once it has been achieved. The maintenance dose replaces the amount of drug eliminated during each dosing interval, preserving the equilibrium that has been established. The relationship between the maintenance dose and the resulting Css was established earlier: Css(avg) = (F × Dose) / (CL × τ). Rearranging this equation to solve for the dose yields:
Maintenance Dose = (Css(desired) × CL × τ) / F
This formula is the practical tool that clinicians use, whether consciously or through the application of clinical guidelines, whenever they select a dosing regimen for a drug whose pharmacokinetics they understand. Knowing the desired target concentration, the patient’s estimated clearance, the planned dosing interval, and the bioavailability of the chosen route of administration, the required dose can be calculated.
Adjusting the Maintenance Dose
When therapeutic drug monitoring reveals that the achieved Css differs from the desired Css, the maintenance dose can be adjusted proportionally. If the desired Css is 15 mg/L and the measured concentration is 10 mg/L, the dose can be increased by a factor of 1.5 to achieve the target, assuming linear pharmacokinetics. This proportional adjustment is valid because, for drugs with first-order elimination, Css is directly proportional to the dose rate.
The dosing interval can also be adjusted to alter the steady-state concentration without changing the total daily dose. However, while the average Css depends only on the total daily dose and clearance, the peak and trough concentrations at steady state depend on the dosing interval relative to the half-life. Shortening the interval reduces peak-to-trough fluctuations and may bring trough concentrations above the minimum effective concentration without increasing the total daily dose. Lengthening the interval has the opposite effect. The choice of dosing interval must therefore consider both the pharmacokinetic profile of the drug and the tolerability of concentration fluctuations.
Chapter 10: Loading Doses — Bypassing the Waiting Period
When Loading Doses Are Necessary
In certain clinical situations, waiting five half-lives to achieve therapeutic steady-state concentrations is neither acceptable nor safe. Patients with severe sepsis, status epilepticus, acute cardiac arrhythmias, or life-threatening thromboembolic events require immediate therapeutic drug levels. A loading dose, which is a larger initial dose designed to rapidly achieve target plasma concentrations, can be administered to bridge the gap while maintenance dosing begins to accumulate drug in the background.
The loading dose does not affect the eventual steady-state concentration; it simply brings the patient to that concentration more quickly. The loading dose is calculated based on the target concentration and the volume of distribution, without regard for clearance or elimination half-life:
Loading Dose = (Css(desired) × Vd) / F
This formula reflects the fact that to achieve a specific plasma concentration, a certain amount of drug must be present in the body. The volume of distribution relates the amount of drug in the body to the plasma concentration. If the desired Css is 15 mg/L and the volume of distribution is 0.7 L/kg, then a seventy-kilogram patient requires a loading dose of 15 × 0.7 × 70 = 735 mg to achieve that concentration immediately, assuming intravenous administration with one hundred percent bioavailability.
Clinical Examples of Loading Dose Use
Vancomycin for serious methicillin-resistant Staphylococcus aureus infections illustrates the loading dose principle well. Current guidelines recommend a loading dose of twenty to thirty-five milligrams per kilogram of actual body weight for critically ill patients to rapidly achieve therapeutic concentrations. This loading dose is administered regardless of renal function because the volume of distribution, not clearance, determines the initial peak concentration. The maintenance dose is subsequently adjusted based on renal function to maintain the desired steady-state levels.
Digoxin loading for rapid ventricular rate control in atrial fibrillation is another classic example. A total loading dose of ten to fifteen micrograms per kilogram is administered in divided doses over twelve to twenty-four hours, with careful monitoring for signs of toxicity. The loading dose is followed by a daily maintenance dose that replaces the amount eliminated, typically 0.125 to 0.25 mg in patients with normal renal function.
Phenytoin loading for status epilepticus or for rapid achievement of therapeutic levels in patients with frequent seizures is calculated similarly, although the unique saturable pharmacokinetics of phenytoin, discussed later in this article, complicate the maintenance dosing phase.
Chapter 11: Therapeutic Drug Monitoring at Steady State
The Purpose and Principles of TDM
Therapeutic drug monitoring (TDM) involves measuring drug concentrations in biological fluids, most commonly plasma or serum, to guide dose individualization and optimize pharmacotherapy. TDM is most valuable for drugs with well-defined therapeutic ranges, narrow therapeutic indices, significant interindividual pharmacokinetic variability, and a clear relationship between plasma concentration and clinical effect or toxicity. Drugs commonly monitored include aminoglycosides, vancomycin, digoxin, lithium, phenytoin, valproic acid, carbamazepine, cyclosporine, tacrolimus, and theophylline.
The fundamental assumption of TDM is that the plasma concentration reflects the concentration at the site of action and correlates with the pharmacological response. For many drugs, this assumption holds reasonably well, although exceptions exist. For example, the effect of warfarin depends not only on the warfarin concentration but also on vitamin K status, the synthesis rate of clotting factors, and genetic polymorphisms in the target enzyme. Nonetheless, TDM provides an objective basis for dose adjustment that supplements clinical judgment.
Correct Timing of Blood Sampling
The timing of blood sample collection relative to the dose is critical for meaningful interpretation of drug levels. A concentration drawn without reference to the dosing interval provides little useful information and may lead to inappropriate dose adjustments. Trough concentrations, drawn immediately before the next dose is due, are the standard for most drugs monitored at steady state. Trough levels reflect the minimum concentration to which the patient is exposed throughout the dosing interval and are most reproducible because they are least affected by variations in absorption rate.
Peak concentrations are relevant for certain drugs, particularly aminoglycosides, where high peak levels correlate with bactericidal efficacy. Aminoglycoside peaks are typically drawn thirty to sixty minutes after the end of an intravenous infusion. Drawing a peak level too early, before distribution into tissues is complete, yields an artifactually high concentration that does not reflect the concentration at the site of infection.
For drugs with long half-lives, such as digoxin, levels should be drawn at least six to eight hours after the last dose, and preferably just before the next dose, to allow distribution to reach equilibrium. Digoxin levels drawn during the distribution phase, within the first few hours after administration, are markedly higher than the concentrations that prevail at the cardiac tissue level and can be grossly misleading if used for clinical decision-making.
Ensuring Steady State Before Sampling
The most common error in therapeutic drug monitoring is drawing levels before steady state has been achieved. A vancomycin trough drawn before the second dose in a patient with normal renal function will be significantly lower than the trough at steady state. If the clinician interprets this low level as indicating insufficient dosing and escalates the dose, the patient will be exposed to supra-therapeutic and potentially nephrotoxic concentrations once steady state is reached. This error compounds upon itself if the clinician then draws another premature level after the dose escalation and repeats the cycle.
The solution is simple: know the half-life of the drug, estimate it for the individual patient, and wait at least five half-lives before drawing levels for routine monitoring. In patients with impaired renal function, the half-life of renally cleared drugs may be prolonged, and the time to steady state correspondingly extended. A patient with an estimated creatinine clearance of 30 mL/min will have a vancomycin half-life of approximately twenty to thirty hours and may require a week or more to reach steady state. Drawing levels prematurely in such a patient and adjusting doses before the full effect of the current regimen is apparent invites therapeutic misadventure.
Chapter 12: Clinical Applications Across Major Drug Classes
Aminoglycoside Antibiotics
Aminoglycosides, including gentamicin, tobramycin, and amikacin, exhibit concentration-dependent bactericidal activity against aerobic gram-negative bacilli. The efficacy of aminoglycosides correlates with the ratio of the peak concentration to the minimum inhibitory concentration of the infecting organism, while nephrotoxicity and ototoxicity are associated with elevated trough levels reflecting drug accumulation in renal tubular cells and cochlear tissue.
Traditional multiple-daily dosing regimens aim for peak concentrations of five to ten milligrams per liter for gentamicin and tobramycin, with trough levels below two milligrams per liter. Extended-interval, or once-daily, dosing has largely supplanted traditional dosing for many indications because it achieves higher peak-to-MIC ratios for maximal bacterial killing while allowing trough levels to fall below the limit of detection before the next dose, potentially reducing the risk of nephrotoxicity. At steady state with extended-interval dosing, the concentration at twenty-four hours should be negligible, and monitoring typically involves a single level drawn at a specific time point, such as six to fourteen hours after the dose, compared against a nomogram to determine the appropriate dosing interval.
Vancomycin
Vancomycin, a glycopeptide antibiotic active against gram-positive organisms, has been a mainstay of therapy for methicillin-resistant Staphylococcus aureus infections for decades. The pharmacokinetics of vancomycin are best described by a two-compartment model, with a distribution phase lasting one to two hours and an elimination half-life of six to eight hours in patients with normal renal function. The area under the concentration-time curve over twenty-four hours divided by the minimum inhibitory concentration (AUC24/MIC) is now recognized as the pharmacokinetic-pharmacodynamic parameter that best predicts vancomycin efficacy, with a target ratio of four hundred to six hundred for serious MRSA infections.
Achieving this AUC target while avoiding trough concentrations above fifteen to twenty milligrams per liter, which have been associated with an increased risk of nephrotoxicity, requires careful dosing and monitoring. Steady-state trough concentrations between ten and fifteen milligrams per liter generally correlate with AUC targets when the MIC is one milligram per liter or less, but the correlation is imperfect. Bayesian dose individualization using population pharmacokinetic models and measured drug levels is increasingly employed to estimate individual patient AUC and guide dosing with greater precision than trough-based monitoring alone.
Phenytoin and Saturable Pharmacokinetics
Phenytoin presents a unique challenge to steady-state dosing because it does not follow first-order elimination kinetics at therapeutic concentrations. The hepatic enzymes responsible for phenytoin metabolism are saturable within the clinically relevant concentration range, meaning that the rate of drug elimination approaches a constant maximum rather than increasing proportionally with concentration. The pharmacokinetics are described by the Michaelis-Menten model, in which the elimination rate equals (Vmax × C) / (Km + C), where Vmax is the maximum rate of metabolism and Km is the concentration at which the rate is half-maximal.
For drugs with saturable elimination, the relationship between dose and steady-state concentration is nonlinear. A small increase in dose can produce a disproportionately large increase in Css as the metabolic pathway approaches saturation. A patient whose phenytoin level is eight milligrams per liter on a dose of 300 mg per day may see the level jump to fifteen or twenty milligrams per liter with a dose increase to only 400 mg per day. Conversely, a patient whose level is toxic at twenty-five milligrams per liter may require only a modest dose reduction to bring the level into the therapeutic range. This nonlinearity makes phenytoin dosing intrinsically less predictable than dosing of drugs with linear kinetics and underscores the importance of therapeutic drug monitoring with cautious, incremental dose adjustments.
Digoxin
Digoxin steady-state concentrations correlate with both therapeutic effects in systolic heart failure, where modest levels in the range of 0.5 to 0.9 nanograms per milliliter improve symptoms and reduce hospitalizations, and toxic effects, which become increasingly common at levels above 1.2 to 2.0 nanograms per milliliter depending on individual patient susceptibility. Digoxin is eliminated primarily by the kidneys, with a clearance that parallels creatinine clearance. Patients with renal impairment require reduced maintenance doses to avoid accumulation and toxicity.
The distribution of digoxin into tissues, particularly the myocardium, is slow relative to the dosing interval, which is why steady state is not reached for several weeks even though the plasma half-life is only one to two days. The delayed tissue distribution also explains why serum levels drawn within the first six to eight hours after a dose do not reflect tissue concentrations and should not be used for clinical decision-making.
Lithium
Lithium, used in the management of bipolar disorder, has one of the narrowest therapeutic indices of any drug in common use. The target serum concentration for maintenance therapy is typically 0.6 to 0.8 millimoles per liter, with levels above 1.5 millimoles per liter associated with increasing risk of toxicity affecting the central nervous system, kidneys, and gastrointestinal tract. Lithium is eliminated almost entirely by the kidneys, with clearance approximating twenty-five percent of creatinine clearance. States of sodium depletion, including dehydration, diuretic therapy, and low-sodium diets, increase proximal tubular reabsorption of lithium and reduce its clearance, potentially causing toxic concentrations in patients previously stable on their regimen.
Steady-state lithium levels are typically drawn as twelve-hour post-dose troughs. The time to steady state in patients with normal renal function is approximately five to seven days, consistent with a half-life of about twenty-four hours. Patients initiated on lithium require monitoring after this interval and periodically thereafter, with increased frequency during periods of illness, medication changes, or dietary modifications that could affect sodium balance and lithium clearance.
Immunosuppressants: Tacrolimus and Cyclosporine
The calcineurin inhibitors tacrolimus and cyclosporine form the backbone of immunosuppressive therapy in solid organ transplantation. Both drugs have narrow therapeutic indices, with underexposure leading to allograft rejection and overexposure causing nephrotoxicity, neurotoxicity, and an increased risk of infection and malignancy. Both drugs are metabolized primarily by CYP3A4 in the liver and intestinal mucosa and are substrates for the P-glycoprotein efflux transporter. This dual dependence on CYP3A4 and P-glycoprotein makes their pharmacokinetics highly variable between patients and susceptible to a wide range of drug interactions.
Therapeutic drug monitoring of tacrolimus and cyclosporine is performed using trough whole-blood concentrations, which correlate reasonably well with total drug exposure as measured by the area under the concentration-time curve. Target trough ranges depend on the type of organ transplanted, the time since transplantation, the concomitant immunosuppressive regimen, and the patient’s immunological risk. Achieving therapeutic steady-state concentrations requires careful initial dosing based on weight, frequent monitoring in the early post-transplant period, and ongoing vigilance for drug interactions that could drastically alter clearance.
Chapter 13: Disease States That Alter Steady-State Pharmacokinetics
Chronic Kidney Disease
Chronic kidney disease affects drug disposition through multiple mechanisms. Reduced glomerular filtration directly impairs the clearance of drugs eliminated primarily by renal excretion. Accumulation of uremic toxins can inhibit drug-metabolizing enzymes and transporters in the liver and intestine, reducing nonrenal clearance pathways. Hypoalbuminemia, common in nephrotic syndrome and advanced renal failure, alters protein binding and increases the free fraction of highly protein-bound acidic drugs. Volume overload expands the extracellular fluid compartment and may increase the volume of distribution of hydrophilic drugs.
The net effect on steady-state concentration depends on the interplay of these changes. A drug that is primarily eliminated renally and has a narrow therapeutic index, such as digoxin or vancomycin, will require dose reduction in proportion to the decline in glomerular filtration rate. The revised maintenance dose can be estimated by calculating the patient’s creatinine clearance and adjusting the dose based on the fraction of the drug eliminated unchanged in the urine. Published dosing guidelines and institutional protocols provide specific recommendations for common renally cleared drugs, but individual therapeutic drug monitoring remains the gold standard when available.
Hepatic Impairment
Liver disease alters drug disposition through reductions in hepatic blood flow, hepatocyte mass, and the activity of drug-metabolizing enzymes. The synthesis of plasma proteins, particularly albumin, declines, reducing the binding of acidic drugs and increasing their free fractions. Portal hypertension leads to the development of portosystemic shunts, which allow orally administered drugs to bypass the liver’s first-pass metabolism, increasing bioavailability and potentially causing toxicity at doses that are safe in patients with normal hepatic function.
For drugs with high hepatic extraction ratios, such as morphine, propranolol, and verapamil, clearance depends primarily on hepatic blood flow. In cirrhosis with portal hypertension, hepatic blood flow may be reduced, leading to decreased clearance and higher steady-state concentrations. Additionally, the loss of first-pass metabolism in the presence of portosystemic shunts increases oral bioavailability, further elevating Css. For drugs with low hepatic extraction ratios, such as warfarin, phenytoin, and most benzodiazepines, clearance depends on the intrinsic metabolic capacity of the liver and the extent of protein binding. In liver disease, reduced enzyme activity decreases clearance, while reduced protein binding increases the free fraction. The net effect on free drug concentration at steady state is complex and requires individualized assessment.
The Child-Pugh classification, while originally developed to predict surgical outcomes in patients with cirrhosis, is frequently used in drug labeling to provide guidance on dose adjustments in hepatic impairment. However, the Child-Pugh score provides only a rough estimate of metabolic capacity, and therapeutic drug monitoring, where available, offers a more reliable basis for dose individualization.
Heart Failure and Hemodynamic Compromise
Heart failure reduces cardiac output and redistributes blood flow to vital organs at the expense of splanchnic, renal, and skeletal muscle perfusion. Reduced hepatic blood flow decreases the clearance of high-extraction drugs, while reduced renal perfusion impairs the elimination of renally cleared drugs. Gut wall edema and reduced gastrointestinal motility can delay and reduce the absorption of orally administered drugs. The expanded volume of distribution resulting from fluid overload may reduce peak concentrations of hydrophilic drugs, while hepatic congestion impairs drug-metabolizing capacity.
Patients admitted with acute decompensated heart failure often have fluctuating renal function as diuresis and hemodynamic support are titrated. Drugs that are cleared renally, such as digoxin and many beta-lactam antibiotics, may require frequent dose adjustment as renal function improves or declines. Therapeutic drug monitoring, when available, is particularly valuable in this setting because the usual estimation equations for creatinine clearance perform poorly in patients with rapidly changing renal function and abnormal fluid status.
Critical Illness and Sepsis
Critically ill patients with sepsis exhibit a complex and dynamic array of pharmacokinetic alterations. The systemic inflammatory response increases cardiac output and microvascular permeability, expanding the volume of distribution for hydrophilic drugs. Hypoalbuminemia alters protein binding. Hepatic blood flow may initially increase during the hyperdynamic phase of sepsis, augmenting the clearance of high-extraction drugs, but can decline as organ dysfunction develops. Renal function may be augmented during the hyperdynamic phase, a phenomenon known as augmented renal clearance, resulting in subtherapeutic concentrations of renally cleared antibiotics when standard doses are used. Conversely, acute kidney injury reduces clearance and promotes drug accumulation.
The unpredictable nature of pharmacokinetics in critical illness makes standard dosing regimens unreliable. Therapeutic drug monitoring of antibiotics, including beta-lactams, vancomycin, and aminoglycosides, is increasingly recognized as a tool to optimize dosing in the intensive care unit. Achieving therapeutic steady-state concentrations early in the course of infection is associated with improved outcomes in sepsis, and prompt dose individualization based on measured drug levels can reduce the risk of both therapeutic failure and drug toxicity.
Obesity
Obesity alters body composition, increasing both adipose tissue mass and lean body mass relative to ideal body weight. These changes affect the volume of distribution of many drugs, necessitating larger loading doses for drugs that distribute into these expanded compartments. The effect of obesity on drug clearance is more variable. Glomerular filtration rate may be increased in obesity, augmenting the clearance of renally eliminated drugs. Hepatic clearance may be increased, decreased, or unchanged depending on the specific metabolic pathway and the presence of comorbid conditions such as nonalcoholic fatty liver disease.
Selecting an appropriate weight descriptor for pharmacokinetic calculations in obesity can be confusing. Total body weight, ideal body weight, adjusted body weight, and lean body weight have each been proposed for specific drugs and clinical scenarios. For vancomycin, current guidelines recommend dosing based on total body weight, with loading doses of twenty to thirty-five milligrams per kilogram and maintenance doses guided by therapeutic drug monitoring. For aminoglycosides, adjusted body weight has traditionally been used, although lean body weight may be more appropriate. The critical point for clinicians is to recognize that standard dosing recommendations derived from non-obese populations may not apply to patients with obesity and that therapeutic drug monitoring should be used proactively when available.
Chapter 14: Drug Interactions That Alter Steady-State Concentration
Enzyme Inhibition
Enzyme inhibition, particularly of the cytochrome P450 isoenzymes, is among the most clinically significant causes of altered steady-state concentrations. Inhibitors can be competitive, binding reversibly to the active site of the enzyme, or mechanism-based, requiring metabolic activation by the enzyme to produce a reactive intermediate that irreversibly inactivates it. Regardless of the mechanism, the result is reduced clearance of substrate drugs and elevated steady-state concentrations.
The clinical significance of an inhibitory interaction depends on several factors: the magnitude of the reduction in clearance, the therapeutic index of the affected drug, and the concentration-response relationship for toxicity. A fifty percent increase in the Css of a drug with a wide therapeutic index, such as a proton pump inhibitor, is unlikely to cause harm. The same increase in the Css of a drug like warfarin, which has a narrow therapeutic index and a steep concentration-response relationship for bleeding risk, can be catastrophic.
Classic examples of clinically important inhibitory interactions include the effect of macrolide antibiotics such as erythromycin and clarithromycin on CYP3A4 substrates, leading to increased concentrations of statins with a risk of rhabdomyolysis, and the effect of azole antifungals such as ketoconazole and itraconazole on the same enzyme, which can elevate concentrations of immunosuppressants, benzodiazepines, and oral anticoagulants. The interaction between the CYP2C9 inhibitor fluconazole and phenytoin is another well-documented example that can lead to phenytoin toxicity if the dose is not reduced proactively.
Enzyme Induction
Enzyme induction increases the synthesis and activity of drug-metabolizing enzymes, accelerating the clearance of substrate drugs and reducing their steady-state concentrations. Induction develops over days to weeks as new enzyme protein is synthesized and accumulates. The time course of induction depends on the half-life of the affected enzyme and the dosing schedule of the inducer. The loss of therapeutic effect resulting from enzyme induction may be gradual and insidious, escaping detection until clinical consequences such as graft rejection, seizure recurrence, or unintended pregnancy occur.
Rifampin is the prototypical and most clinically important enzyme inducer, activating the pregnane X receptor to upregulate CYP3A4, CYP2C9, CYP2C19, and several other enzymes and transporters. The induction of warfarin metabolism by rifampin is so pronounced that maintaining therapeutic anticoagulation often requires doses two to three times the usual requirement. When rifampin is discontinued, the inductive effect wanes over one to two weeks, and warfarin doses must be correspondingly reduced to avoid supratherapeutic anticoagulation and bleeding.
Other important inducers include the antiepileptic drugs phenytoin, carbamazepine, and phenobarbital; the herbal antidepressant St. John’s wort; and certain antiretroviral agents. Clinicians must anticipate induction interactions, monitor for loss of therapeutic effect, and adjust doses of affected drugs accordingly. When the inducer is discontinued, the dose of the substrate drug must be proactively reduced to prevent toxicity.
Protein-Binding Displacement
Displacement of one drug from plasma protein-binding sites by another drug can transiently increase the free concentration of the displaced drug. For drugs with high protein binding and low extraction ratios, such as warfarin and phenytoin, displacement interactions have traditionally been emphasized as clinically significant. However, the transient increase in free concentration is followed by increased clearance because more free drug is available for elimination. At steady state, the total concentration of the displaced drug decreases, but the free concentration returns to its pre-displacement value.
The clinical reality is that protein-binding displacement interactions are rarely of sustained clinical significance unless the displacing drug also inhibits the metabolism or renal clearance of the displaced drug. Valproic acid, for example, both displaces phenytoin from albumin and inhibits its metabolism. The result is a sustained increase in free phenytoin concentration and the potential for toxicity, even if the total phenytoin concentration remains within the therapeutic range. This interaction illustrates why measuring free drug concentrations is essential when protein-binding interactions are suspected.
Chapter 15: Clinical Case Studies Illustrating Steady-State Principles
Case One: Vancomycin Dosing in a Patient with Fluctuating Renal Function
A fifty-eight-year-old man with type 2 diabetes mellitus, hypertension, and chronic kidney disease at baseline, with an estimated creatinine clearance of 45 mL/min, is admitted to the intensive care unit with septic shock secondary to a methicillin-resistant Staphylococcus aureus bloodstream infection. Blood cultures are drawn, and intravenous vancomycin is initiated with a loading dose of 25 mg/kg based on actual body weight, followed by a maintenance dose of 15 mg/kg every twelve hours while awaiting culture results and therapeutic drug monitoring.
On hospital day three, the patient develops acute kidney injury in the setting of persistent hypotension requiring vasopressor support. His urine output declines to less than 0.5 mL/kg/hour, and his serum creatinine rises from 1.8 mg/dL to 3.2 mg/dL. A vancomycin trough level drawn before the fourth scheduled dose returns at 22 mg/L, above the target range of 10 to 15 mg/L. The infectious disease pharmacist recalculates the patient’s estimated creatinine clearance, which is now 25 mL/min, and recommends extending the dosing interval to every twenty-four hours while maintaining the same dose. A repeat trough level is ordered before the third dose of the revised regimen.
This case illustrates several critical steady-state concepts. The initial loading dose was appropriate and independent of renal function, providing immediate therapeutic concentrations. The subsequent rise in serum creatinine reflects a reduction in vancomycin clearance, and the elevated trough level confirms drug accumulation. Because vancomycin clearance is proportional to creatinine clearance, a decline in renal function of this magnitude approximately doubles the half-life and requires a proportional reduction in the dose rate. Extending the dosing interval achieves this reduction without altering the peak concentration, preserving the concentration-dependent killing that contributes to vancomycin efficacy. The decision to check a trough before the third dose of the new regimen, rather than waiting five half-lives of approximately forty to fifty hours, represents a practical compromise between pharmacokinetic precision and the clinical urgency of ensuring therapeutic levels in a critically ill patient.
Case Two: Phenytoin Toxicity Following a Modest Dose Increase
A thirty-four-year-old woman with localization-related epilepsy has been maintained on oral phenytoin 300 mg at bedtime for several years, with seizure freedom and trough levels consistently between 10 and 14 mg/L. After experiencing two breakthrough seizures over a six-week period, her neurologist increases the dose to 400 mg at bedtime. Three weeks later, the patient presents to the emergency department with nystagmus, ataxia, and slurred speech. A stat phenytoin level returns at 32 mg/L.
The patient’s clinical presentation is classic for phenytoin neurotoxicity resulting from the nonlinear relationship between dose and steady-state concentration. At 300 mg daily, her metabolic capacity was operating near the Vmax of her CYP2C9 system. The thirty-three percent increase in dose saturated the remaining metabolic capacity, resulting in a disproportionate increase in Css from approximately 12 mg/L to 32 mg/L. The appropriate management includes holding phenytoin and allowing the concentration to decline. Because elimination at these concentrations is essentially zero-order, the decline will be linear at a rate determined by the patient’s Vmax, typically five to ten milligrams per liter per day. The neurologist will need to resume phenytoin at a dose only modestly higher than the original 300 mg, perhaps 325 or 350 mg daily, and recheck a level after two to three weeks.
Case Three: Digoxin Accumulation in a Patient with Worsening Renal Function
A seventy-eight-year-old man with systolic heart failure and atrial fibrillation has been stable on oral digoxin 0.125 mg daily for over two years. His renal function at the time of digoxin initiation was stable, with a serum creatinine of 1.2 mg/dL and an estimated creatinine clearance of 55 mL/min. Over the past six months, his heart failure has progressed, and his renal function has slowly declined. He presents to his primary care physician with a two-week history of anorexia, nausea, fatigue, and visual disturbances described as seeing yellow-green halos around lights. Laboratory testing reveals a serum creatinine of 2.4 mg/dL and a digoxin level of 3.4 ng/mL.
The patient’s presentation is consistent with chronic digoxin toxicity resulting from drug accumulation as renal clearance declined. At his original creatinine clearance of 55 mL/min, the digoxin half-life was approximately forty to fifty hours, and his 0.125 mg daily dose maintained therapeutic concentrations. With the decline in creatinine clearance to an estimated 25 mL/min, the digoxin half-life has likely extended to approximately three to four days. His maintenance dose of 0.125 mg daily, which previously replaced the amount of drug eliminated each day, is now excessive, and digoxin has accumulated to a toxic steady-state concentration. Management includes withholding digoxin, monitoring the electrocardiogram for evidence of digoxin toxicity including bradyarrhythmias and ventricular ectopy, and supporting renal function. Digoxin-specific antibody fragments (Digibind) are indicated for life-threatening toxicity but would not be required in this case if the patient is hemodynamically stable without malignant arrhythmias. Once the digoxin level returns to the therapeutic range, resumption of therapy at a reduced dose of 0.0625 mg daily, or 0.125 mg on alternate days, guided by follow-up levels, would be appropriate.
Chapter 16: Advantages of Steady-State Dosing
The steady-state approach to pharmacotherapy offers several important advantages over empiric dosing without attention to pharmacokinetic principles. First, it provides a rational framework for dose selection based on measurable patient characteristics such as weight, renal function, and hepatic function, rather than relying solely on standard doses that may be inappropriate for individual patients.
Second, steady-state monitoring allows objective verification that the chosen regimen is achieving therapeutic concentrations. When combined with clinical assessment, this verification provides confidence that an apparently inadequate therapeutic response reflects true pharmacodynamic resistance rather than subtherapeutic dosing, or that suspected drug toxicity is indeed related to supratherapeutic concentrations.
Third, the steady-state paradigm facilitates dose individualization. When a measured concentration deviates from the target, the dose can be adjusted proportionally with reasonable confidence that the new steady-state concentration will approximate the target. This iterative process of measurement and adjustment moves empiric prescribing toward truly personalized pharmacotherapy.
Fourth, understanding the time course of drug accumulation and elimination enables clinicians to interpret clinical responses appropriately, avoiding premature judgments about efficacy or toxicity and counseling patients realistically about when to expect therapeutic benefits or the resolution of adverse effects.
Chapter 17: Limitations and Caveats
The steady-state model, while powerful, has important limitations that must be recognized. The equations assume linear pharmacokinetics with first-order elimination, yet several clinically important drugs exhibit nonlinear or saturable kinetics at therapeutic concentrations. Phenytoin, as discussed, follows Michaelis-Menten kinetics and does not exhibit a proportional relationship between dose and Css. Other drugs, including salicylates, ethanol, and high-dose methotrexate, also display saturable elimination at relevant concentrations.
The model assumes that clearance remains constant over time, yet critically ill patients, patients with acute kidney injury, and patients receiving interacting drugs may experience substantial fluctuations in clearance that invalidate predictions based on single point measurements. Therapeutic drug monitoring and dose adjustment must be an ongoing process, not a single event, when patient physiology is dynamic.
The equations also assume that the relevant concentration for therapeutic and toxic effects is the plasma concentration, yet for many drugs, the site of action is intracellular, within the central nervous system, or in other tissue compartments that equilibrate slowly with plasma. The relationship between plasma concentration and effect may exhibit hysteresis, with effects lagging behind plasma concentrations during both accumulation and elimination.
Finally, the equations do not account for pharmacodynamic variability. Two patients with identical plasma concentrations may experience different therapeutic responses and different toxicity profiles due to genetic differences in drug targets, receptor sensitivity, or downstream signaling pathways. Pharmacokinetic optimization is necessary but not sufficient for achieving the best possible clinical outcome.
Chapter 18: Common Mistakes in Clinical Practice
Drawing Drug Levels Before Steady State Is Reached
This is perhaps the single most common error in therapeutic drug monitoring. A vancomycin trough drawn after the second dose, a digoxin level checked three days after starting therapy, a phenytoin level obtained five days after a dose change — all of these will reflect concentrations lower than those that will eventually prevail at steady state. Acting on these premature levels, particularly by escalating doses, places patients at risk for subsequent toxicity. The rule is simple: know the drug’s half-life in the individual patient, wait five half-lives, then draw the level.
Confusing Loading Dose and Maintenance Dose Principles
Loading doses are calculated using volume of distribution; maintenance doses are calculated using clearance. A loading dose does not accelerate the achievement of steady state; it simply places the patient at the steady-state concentration immediately. A patient who receives a loading dose requires the same time to reach steady state as one who does not; the difference is that the patient who receives a loading dose begins therapy at the target concentration. Failing to reduce the maintenance dose in a patient with impaired clearance while administering a loading dose will produce an initial therapeutic peak followed by progressive accumulation to toxic concentrations.
Assuming That a Standard Dose Achieves a Standard Concentration
Pharmacokinetic variability between patients is substantial and clinically significant. Standard doses of drugs with narrow therapeutic indices will produce therapeutic concentrations in some patients, subtherapeutic concentrations in others, and toxic concentrations in a minority. Therapeutic drug monitoring exists precisely because this variability cannot be reliably predicted from demographic characteristics alone. The clinician who assumes that a standard dose obviates the need for monitoring abdicates responsibility for the individual patient’s safety and therapeutic outcome.
Neglecting Drug Interactions
Polypharmacy is increasingly common, particularly in elderly patients and those with multiple chronic conditions. Each added medication introduces the potential for pharmacokinetic interactions that can alter the steady-state concentration of existing therapies. A thorough medication reconciliation at every clinical encounter, with specific attention to inducers and inhibitors of drug-metabolizing enzymes and to drugs that compete for renal tubular secretion, is essential for avoiding unintended alterations in drug exposure.
Misinterpreting Laboratory Results
A drug concentration is a number, not a clinical judgment. The same concentration that is therapeutic in one clinical context may be toxic in another, depending on the patient’s comorbidities, the indication for therapy, and the concomitant use of other medications. A digoxin level of 1.0 ng/mL is appropriate for a patient with systolic heart failure but may be contributing to atrial fibrillation with slow ventricular response in a patient with sick sinus syndrome. A vancomycin trough of 15 mg/L is acceptable for a patient with MRSA pneumonia but unnecessary for a patient receiving vancomycin for surgical prophylaxis. The laboratory value must be interpreted in the context of the individual patient.
Chapter 19: Frequently Asked Questions
Question . What is steady-state concentration?
Question . How long does it take to reach steady state?
Question . Why are five half-lives considered the time to steady state?
Question . Can loading doses shorten the time to steady state?
Question . What drugs require therapeutic drug monitoring?
Question . How does renal disease affect Css?
Question . Does changing the dose immediately change steady state?
Question . What is the difference between peak and trough levels?
Question . Can steady-state concentration prevent toxicity?
Question . What happens if a dose is missed?
Question . How does obesity affect steady-state concentration?
Question . What is the accumulation index?
Question . How do CYP450 inducers affect Css?
Question . How do CYP450 inhibitors affect Css?
Question . Why is digoxin monitoring performed after distribution equilibrium?
Question . What is augmented renal clearance and how does it affect Css?
Question . Can pharmacogenetic testing predict Css?
Question . What is the difference between total and free drug concentration?
Question . How does pregnancy affect steady-state drug concentrations?
Question . Why are some drugs dosed by body surface area?
Chapter 20: Key Takeaways for Clinical Practice
Steady-state concentration represents the pharmacological endpoint of any maintenance dosing regimen. Understanding the principles that govern its achievement and maintenance is fundamental to rational, safe, and effective prescribing.
The time required to reach steady state depends exclusively on the drug’s elimination half-life. For practical purposes, five half-lives mark the point at which steady state has been attained. This principle applies to the initiation of therapy, to dose adjustments, and to the elimination of drug after discontinuation. Internalizing this rule prevents premature therapeutic judgments and mistimed therapeutic drug monitoring.
The average steady-state concentration is determined by the dose rate (dose divided by interval, corrected for bioavailability) and the clearance. This simple relationship provides the basis for initial dose selection and for dose adjustment when measured concentrations deviate from the target.
Loading doses are calculated using volume of distribution and achieve immediate target concentrations without altering the time required to reach steady-state equilibrium. They are indicated when the clinical situation demands immediate therapeutic effect and the consequences of delayed treatment are unacceptable.
Therapeutic drug monitoring is the clinical tool that transforms pharmacokinetic principles into individualized pharmacotherapy. To be interpretable, drug levels must be drawn at steady state, at the appropriate time relative to the dosing interval, and with knowledge of the patient’s clinical status, including organ function and concomitant medications.
Disease states that alter clearance, most importantly renal impairment and hepatic dysfunction, require proportional adjustments to maintenance dosing. Drug interactions involving enzyme inhibition or induction can profoundly alter steady-state concentrations and must be anticipated, monitored, and managed proactively.
Pharmacokinetic equations provide a starting point for dosing, but individual variability demands that clinicians treat these predictions as hypotheses to be tested against measured drug levels and clinical response. The art of pharmacotherapy lies in applying population-based principles to the unique patient, adjusting doses in response to objective data, and maintaining humility about the limits of our predictive ability.
Conclusion: From Bathtub to Bedside
We began with a bathtub. Water flowing in, water draining out, and a water level that eventually stabilizes when the two rates match. This simple image contains the essence of clinical pharmacokinetics and the steady-state principle that guides dosing for thousands of patients every day in hospitals and clinics around the world.
The journey from that bathtub to the bedside of a critically ill patient receiving vancomycin, to the neurology clinic where phenytoin levels are carefully titrated, to the transplant unit where tacrolimus concentrations are monitored with precision, is a journey of increasing complexity. Yet the fundamental principle remains unchanged. At steady state, input equals output. The concentration that results is the concentration the patient experiences, hour after hour, day after day, for the duration of therapy.
Mastering steady-state pharmacokinetics is not an academic exercise. It is a clinical imperative that directly affects patient outcomes. The clinician who understands when to draw a drug level, how to interpret the result, and how to adjust the dose in response is practicing medicine at a higher level of precision. The clinician who does not risks therapeutic failure, avoidable toxicity, and the erosion of trust that follows when treatments do not work or cause unexpected harm.
As you encounter these concepts in your own practice, whether as a student learning to calculate maintenance doses for the first time or as an experienced prescriber managing complex patients with multiple interacting medications, return to the fundamentals. Know the half-life. Estimate the clearance. Calculate the dose. Verify with therapeutic drug monitoring. Adjust as needed. These steps, repeated faithfully, constitute the daily work of rational pharmacotherapy and the practical application of steady-state science to the care of real patients.
References
1. Brunton LL, Hilal-Dandan R, Knollmann BC. Goodman & Gilman’s The Pharmacological Basis of Therapeutics. 14th ed. New York: McGraw-Hill Education; 2022.
2. Katzung BG, Vanderah TW. Basic & Clinical Pharmacology. 16th ed. New York: McGraw-Hill; 2023.
3. Ritter JM, Flower RJ, Henderson G, Loke YK, MacEwan DJ, Rang HP. Rang & Dale’s Pharmacology. 10th ed. London: Elsevier; 2023.
4. Rowland M, Tozer TN. Clinical Pharmacokinetics and Pharmacodynamics: Concepts and Applications. 5th ed. Philadelphia: Wolters Kluwer; 2019.
5. Bauer LA. Applied Clinical Pharmacokinetics. 4th ed. New York: McGraw-Hill; 2023.
6. Joint Formulary Committee. British National Formulary. London: BMJ Group and Pharmaceutical Press; 2024.
7. American Society of Health-System Pharmacists. AHFS Drug Information. Bethesda: ASHP; 2024.
8. U.S. Food and Drug Administration. Guidance for Industry: Pharmacokinetics in Patients with Impaired Renal Function — Study Design, Data Analysis, and Impact on Dosing. Silver Spring: FDA; 2020.
9. European Medicines Agency. Guideline on the Evaluation of the Pharmacokinetics of Medicinal Products in Patients with Impaired Renal Function. Amsterdam: EMA; 2021.
10. World Health Organization. WHO Model List of Essential Medicines. Geneva: WHO; 2023.
11. Centers for Disease Control and Prevention. Therapeutic Drug Monitoring. Atlanta: CDC; 2022.
12. National Institutes of Health. Principles of Clinical Pharmacology. Bethesda: NIH Clinical Center; 2023.
13. Rybak MJ, Le J, Lodise TP, et al. Therapeutic Monitoring of Vancomycin for Serious Methicillin-Resistant Staphylococcus aureus Infections: A Revised Consensus Guideline and Review by the American Society of Health-System Pharmacists, the Infectious Diseases Society of America, the Pediatric Infectious Diseases Society, and the Society of Infectious Diseases Pharmacists. Am J Health Syst Pharm. 2020;77(11):835-864.
14. Martin JH, Norris R, Barras M, et al. Therapeutic Drug Monitoring in the Era of Precision Medicine: Opportunities and Challenges. Br J Clin Pharmacol. 2021;87(4):1635-1645.
15. Roberts JA, Abdul-Aziz MH, Lipman J, et al. Individualised Antibiotic Dosing for Patients Who Are Critically Ill: Challenges and Potential Solutions. Lancet Infect Dis. 2014;14(6):498-509.
16. Greenblatt DJ, Harmatz JS, Shader RI. Clinical Pharmacokinetics of Anxiolytics and Hypnotics in the Elderly: Therapeutic Considerations. Clin Pharmacokinet. 1991;21(3):165-177.
17. Benet LZ, Hoener BA. Changes in Plasma Protein Binding Have Little Clinical Relevance. Clin Pharmacol Ther. 2002;71(3):115-121.
18. Patsalos PN, Berry DJ, Bourgeois BF, et al. Antiepileptic Drugs — Best Practice Guidelines for Therapeutic Drug Monitoring: A Position Paper by the Subcommission on Therapeutic Drug Monitoring, ILAE Commission on Therapeutic Strategies. Epilepsia. 2008;49(7):1239-1276.
19. Hiemke C, Bergemann N, Clement HW, et al. Consensus Guidelines for Therapeutic Drug Monitoring in Neuropsychopharmacology: Update 2017. Pharmacopsychiatry. 2018;51(1-2):9-62.
20. Wallemacq P, Armstrong VW, Brunet M, et al. Opportunities to Optimize Tacrolimus Therapy in Solid Organ Transplantation: Report of the European Consensus Conference. Ther Drug Monit. 2009;31(2):139-152.Disclaimer: This article is intended for educational and informational purposes only. It does not constitute medical advice, diagnosis, or treatment. Healthcare professionals should rely on their own clinical judgment, institutional protocols, and current evidence-based guidelines when making prescribing decisions. Medication doses, monitoring parameters, and therapeutic ranges should be verified using authoritative, up-to-date references appropriate to the specific patient and clinical context. The mention of specific drugs, doses, or clinical practices is not an endorsement or recommendation for any particular patient or situation. Always consult official prescribing information, institutional formularies, and relevant specialist guidance. The authors and publishers disclaim any liability for adverse effects arising from the use or application of the information contained herein.