What Is Half-Life of Medicines 4 Critical Formulas in 3 Minutes
Half-Life of Medicines
 half‑life of a medicine is a fundamental pharmacokinetic parameter that determines the duration of drug action, dosing intervals, time to steady state, and the risk of accumulation or toxicity. This comprehensive review provides medical students and healthcare professionals with a rigorous, evidence‑based understanding of drug half‑life – from its mathematical definition and physiological determinants to its clinical applications in dose individualisation, therapeutic drug monitoring, and management of special populations. Special emphasis is placed on first‑ vs. zero‑order kinetics, volume of distribution, clearance, and practical case‑based reasoning. Learn about Basics of Pharmacology
1. Introduction and Historical Context
1.1 What Is the Half‑Life of a Medicine?
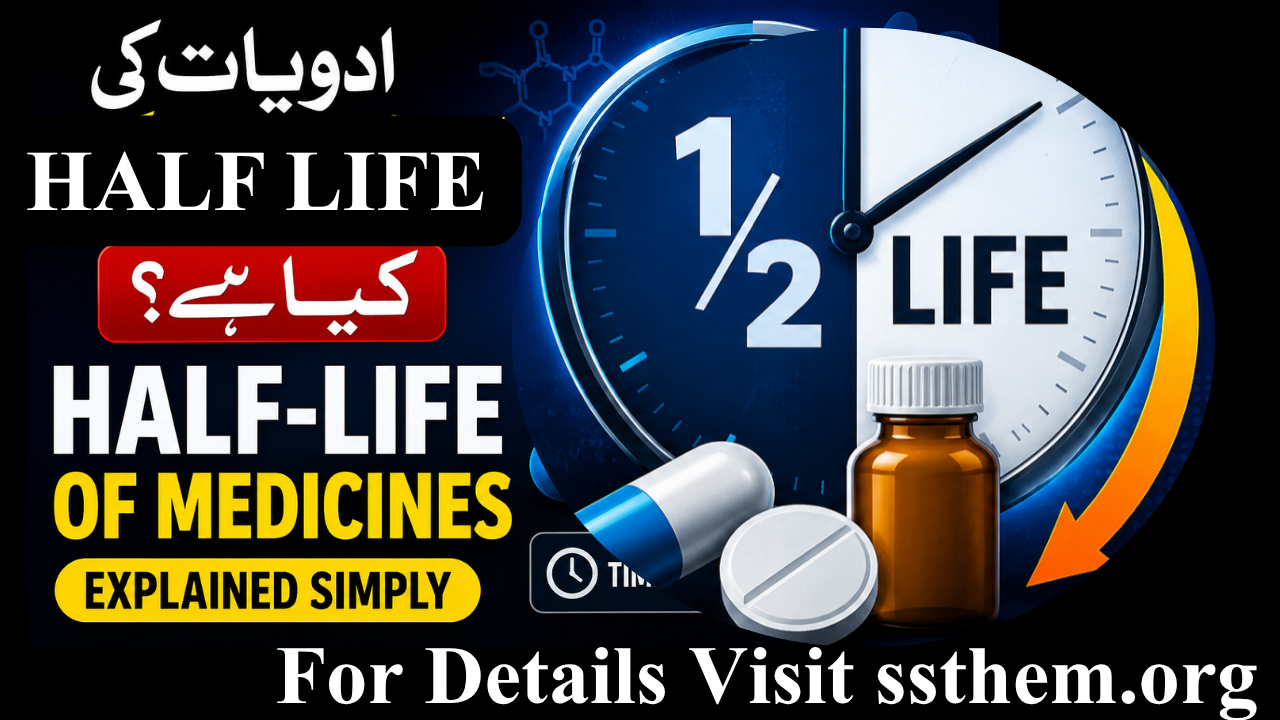
The half‑life (t½) of a medicine is the time required for the concentration of the drug in plasma (or the total amount in the body) to decrease by 50%. It is a direct measure of the rate of drug elimination from the body and is independent of the initial dose only when the drug follows first‑order kinetics – the most common scenario in clinical pharmacology.
Example:
If the initial concentration is 100 mg/L,
after one half‑life it falls to 50 mg/L,
after two to 25 mg/L, and
after five half‑lives to ≈3.125 mg/L (96.875% eliminated). This rule of thumb is invaluable for predicting when a drug will be effectively cleared. Understanding this exponential decay is central to rational prescribing because it allows clinicians to forecast both the onset of therapeutic action and the duration of potential adverse effects.
1.2 Historical Development
The concept of half‑life originated in nuclear physics to describe radioactive decay. It was later adopted by pharmacology in the mid‑20th century as quantitative tools for drug elimination emerged. The pioneering work of Torsten Teorell and others laid the foundation for compartmental modelling, enabling clinicians to relate drug concentration to effect. Today, half‑life is a cornerstone of rational prescribing and is taught in every pharmacology curriculum worldwide. The clinical integration of half‑life calculations began in the 1970s with the widespread availability of serum drug assays, which allowed physicians to individualise therapy for drugs like digoxin and theophylline.
1.3 The Therapeutic Window and Half‑Life
The relationship between half‑life and the therapeutic window is critical. Drugs with a narrow therapeutic index (e.g., warfarin, digoxin, lithium) require precise dosing because small fluctuations in concentration can lead to subtherapeutic effects or toxicity. A prolonged half‑life in such cases increases the time needed to reach steady state but also prolongs the risk period if toxicity occurs. Conversely, drugs with a wide therapeutic window (e.g., penicillins) allow for greater flexibility in dosing intervals without significant safety concerns.
Key Insight: The half‑life is not a fixed property of a drug; it is influenced by patient factors (age, organ function, genetics), drug interactions, and disease states. Understanding these determinants is essential for individualised therapy.
2. Pharmacokinetics: The Foundation of Half-Life of Medicines
2.1 The ADME Framework
Half‑life is determined by the interplay of the four major pharmacokinetic processes:
- Absorption: Entry of the drug into the bloodstream. While absorption does not directly determine the elimination half‑life, it affects the time to peak concentration and the onset of action.
- Distribution: Movement from blood into tissues (governed by volume of distribution).
- Metabolism: Biotransformation, mainly in the liver, which converts lipophilic drugs into more hydrophilic metabolites for excretion.
- Excretion: Removal via kidneys (glomerular filtration, tubular secretion), bile, lungs, or other routes.
The half‑life is mathematically linked to two primary parameters: Clearance (Cl) and Volume of Distribution (Vd).
2.2 The Two Primary Pharmacokinetic Parameters
| Parameter | Definition | Clinical Relevance |
|---|---|---|
| Volume of Distribution (Vd) | Apparent space in the body available to contain the drug Vd = Amount of drug / Plasma concentration |
Determines loading dose; large Vd → long half‑life if clearance is unchanged |
| Clearance (Cl) | Volume of plasma cleared of drug per unit time Cl = Rate of elimination / Concentration |
Determines maintenance dose; reduced Cl → prolonged half‑life |
2.3 Bioavailability and Its Impact
Bioavailability (F) – the fraction of an administered dose that reaches the systemic circulation – does not directly affect half‑life. However, it influences the achieved concentration and thus the clinical effect. For example, a drug with high first‑pass metabolism (e.g., propranolol) may have a low oral bioavailability, but its half‑life is determined by its systemic clearance and Vd, not by F. When switching between intravenous and oral routes, clinicians must adjust doses based on bioavailability differences, but the elimination half‑life remains unchanged for the same patient.
3. First‑Order vs Zero‑Order Kinetics
3.1 First‑Order (Linear) Kinetics
Most drugs follow first‑order kinetics, where a constant fraction of the drug is eliminated per unit time. The elimination rate is proportional to the drug concentration:
- Elimination rate = k × C (k = elimination rate constant)
- The half‑life is constant and independent of dose.
- Example: Amoxicillin (t½ ≈ 1 h), paracetamol (2–3 h), warfarin (36–42 h).
- Clinical implication: Doubling the dose doubles the concentration but does not change the time to eliminate 50%.
3.2 Zero‑Order (Saturable) Kinetics
A few drugs (e.g., ethanol, phenytoin at high doses, aspirin at anti‑inflammatory doses) exhibit zero‑order elimination, where a constant amount of drug is eliminated per unit time, regardless of concentration.
- Elimination rate = constant (e.g., 10 mg/h for ethanol).
- The half‑life increases with dose because it takes longer to eliminate a fixed amount when the concentration is higher.
- Clinical implication: Dose adjustments must be made with caution; small increases in dose can lead to disproportionate rises in steady‑state concentration and toxicity (e.g., phenytoin toxicity).
3.3 Michaelis‑Menten Kinetics – The Phenytoin Example
Phenytoin is the classic clinical example of saturable (Michaelis‑Menten) elimination. At therapeutic concentrations, the metabolic pathways become saturated, and the drug switches from first‑order to zero‑order kinetics. This means that the half‑life is dose‑dependent: at a daily dose of 300 mg, the half‑life might be 22 hours, but at 400 mg, it can exceed 60 hours. This pharmacokinetic behaviour explains why phenytoin dose increases must be small (e.g., 25–30 mg increments) and why therapeutic drug monitoring is essential to avoid neurotoxicity.
4. Mathematics of Half‑Life: Formulas and Calculations
4.1 Core Formula
t½ = 0.693 × Vd / Cl or t½ = 0.693 / k (where k = elimination rate constant)
The constant 0.693 is the natural logarithm of 2 (ln 2). This formula is derived from the exponential decay equation: C(t) = C(0) × e−kt.
4.2 Practical Calculation Examples
| Scenario | Calculation | Result |
|---|---|---|
| Investigational drug: Vd = 40 L, Cl = 2.0 L/h | t½ = (0.7 × 40) / 2.0 | ≈ 14 hours |
| Gentamicin: Vd = 0.3 L/kg (56 kg), t½ = 3 h; initial conc. = 16 mg/L | After 24 h (8 half‑lives): 16 → 8 → 4 → 2 → 1 → 0.5 → 0.25 → 0.125 → 0.0625 | 0.0625 mg/L |
| MDMA: t½ = 7 h; current conc. = 0.6 μg/L; target = 0.15 μg/L | 0.6 → 0.3 (1 t½) → 0.15 (2 t½) | 14 hours |
| Lithium: t½ = 24 h; therapeutic range 0.6–1.2 mmol/L | If level = 2.4 mmol/L, time to 1.2 mmol/L = 1 t½ (24 h) → time to 0.6 = 48 h | Guides monitoring interval |
Rule of Thumb:
- Time to 90% of steady state = 3.3 half‑lives
- Time to 95% of steady state = 4.3 half‑lives
- Time to 99% of steady state = 6.6 half‑lives
5. Types of Half‑Life
| Type | Definition | Clinical Use |
|---|---|---|
| Plasma half‑life | Time for plasma concentration to fall by 50% | Most commonly measured in clinical studies; guides dosing intervals |
| Biological half‑life | Time for total body content to fall by 50% | Relevant for drugs with extensive tissue binding (e.g., amiodarone) |
| Terminal half‑life | Elimination phase after distribution is complete | Useful for long‑term accumulation predictions and washout periods |
| Effective half‑life | Combines elimination and pharmacodynamic effects | Guides duration of action (e.g., for analgesics like morphine) |
6. Factors Affecting Drug Half‑Life
- Age: In the elderly, half‑life is typically 50–75% longer due to reduced renal and hepatic function, decreased cardiac output, and changes in body composition (increased fat, decreased water).
- Kidney function: Renal impairment (e.g., chronic kidney disease) prolongs the half‑life of renally cleared drugs (e.g., aminoglycosides, digoxin, lithium). For a drug like vancomycin, the t½ can increase from 6 hours to >24 hours in severe renal failure.
- Liver function: Cirrhosis or hepatitis slows hepatic metabolism, extending t½ of drugs like diazepam (from 40 h to >100 h), warfarin, and morphine.
- Body composition: Lipophilic drugs (e.g., diazepam, amiodarone) have a larger Vd in obese patients, leading to longer t½. Conversely, hydrophilic drugs (e.g., gentamicin) have a smaller Vd in obesity, potentially shortening t½ if clearance is unaffected.
- Drug interactions: Enzyme inducers (e.g., rifampicin, phenytoin, carbamazepine) shorten t½ by increasing clearance; inhibitors (e.g., cimetidine, fluconazole, erythromycin) prolong t½.
- Genetics: Polymorphisms in CYP450 enzymes (e.g., CYP2D6, CYP2C19, CYP2C9) cause marked interindividual variation in metabolism and, consequently, half‑life. For example, poor metabolisers of CYP2C19 have a longer t½ for omeprazole.
- Volume of distribution changes: Decreased Vd (e.g., dehydration, burns) shortens t½; increased Vd (e.g., pregnancy, oedema, ascites) lengthens it.
- Thyroid status: Hyperthyroidism increases clearance of some drugs (e.g., propranolol), shortening t½; hypothyroidism has the opposite effect.
6.1 Cytochrome P450 – The Key Player
The cytochrome P450 (CYP) superfamily of enzymes, particularly CYP3A4, CYP2D6, and CYP2C9, metabolises approximately 75% of all clinically used drugs. Genetic polymorphisms, environmental factors (smoking, diet), and concomitant medications that modulate CYP activity are major sources of half‑life variability. For instance, co‑administration of a CYP3A4 inhibitor like clarithromycin with a CYP3A4 substrate like midazolam can double the half‑life, leading to prolonged sedation.
7. Drug Accumulation and Steady‑State Concentration
7.1 Drug Accumulation
When a drug is administered repeatedly before the previous dose is completely eliminated, it accumulates. The extent of accumulation depends on the dosing interval relative to the half‑life:
- If dosing interval > 5 t½ → no significant accumulation.
- If dosing interval < 4 t½ → accumulation occurs, and steady state is reached after about 4–5 t½.
- Accumulation index = 1 / (1 − e−k×τ), where τ is the dosing interval.
7.2 Steady‑State Concentration (Css)
Steady state is the point at which drug input (dosing rate) equals drug output (elimination rate). The average steady‑state concentration is given by:
Cssavg = (F × Dose / τ) / Cl
where F = bioavailability, τ = dosing interval, and Cl = clearance.
Clinically, it takes about 4–5 half‑lives to reach steady state – a principle that guides loading dose strategies. For example, fluoxetine (t½ ≈ 4–6 days) takes nearly a month to reach steady state, which explains its slow onset and prolonged washout when switching antidepressants.
For drugs with long half‑lives (e.g., digoxin 36 h, amiodarone 40–60 days), steady state may take weeks. A loading dose is often given to reach therapeutic levels rapidly, followed by a maintenance dose to sustain them.
8. Loading Dose vs Maintenance Dose
| Aspect | Loading Dose | Maintenance Dose |
|---|---|---|
| Purpose | Rapidly achieve therapeutic concentration | Maintain steady‑state concentration |
| Formula | LD = Vd × Ctarget / (F × S) | MD = Ctarget × Cl × τ / F |
| When Used | Drugs with long half‑life (e.g., amiodarone, digoxin) or in emergencies (e.g., status epilepticus with phenytoin) | Always used for chronic therapy |
| Example | Digoxin: 0.5–1 mg IV, then 0.125–0.25 mg daily | Warfarin: 5 mg daily, adjusted by INR |
9. Clinical Significance of Half‑Life
- Dosing interval design: Drugs with short t½ (e.g., amoxicillin ~1 h) require multiple daily doses to maintain effective concentrations; long t½ (e.g., azithromycin 68 h) allow once‑daily or even once‑weekly regimens.
- Time to steady state: Predicts when therapeutic effect will be achieved – critical for chronic conditions like epilepsy or depression.
- Toxicity prevention: Accumulation risk is directly linked to t½ and renal/hepatic function; regular monitoring is required for drugs with narrow therapeutic windows.
- Therapeutic drug monitoring (TDM): Sampling times (trough, peak) are based on t½. For example, vancomycin trough levels are drawn just before the next dose, typically after 4–5 t½ have elapsed.
- Dose adjustment in organ dysfunction: Prolonged t½ requires dose reduction or extended intervals. In renal failure, the t½ of gentamicin increases from 2–3 h to >10 h, necessitating dose interval extension.
- Drug interactions: Changes in clearance due to enzyme inducers/inhibitors alter t½; for example, rifampicin reduces warfarin t½, requiring higher warfarin doses.
- Overdose management: Predicts how long elevated levels persist, guiding the need for interventions such as activated charcoal, enhanced elimination, or antidotes (e.g., digoxin‑specific antibody fragments).
- Surgical planning: Knowing t½ helps decide when to hold anticoagulants (warfarin 36–42 h), antihypertensives, or antiplatelet agents before surgery to minimise bleeding risk.
10. Half‑Life of Common Medicines
| Drug | Approx. t½ (hours) | Notes |
|---|---|---|
| Paracetamol (acetaminophen) | 2–3 | Short; hepatotoxicity risk with overdose; N‑acetylcysteine antidote |
| Ibuprofen | 2 | Short; multiple daily dosing |
| Aspirin (parent drug) | 0.25–0.33 | Very short; salicylate metabolite has longer t½ (3–4 h) |
| Amoxicillin | 1 | Short; needs thrice‑daily dosing; prolonged in renal failure |
| Azithromycin | 68 | Long; once‑daily, short course; tissue accumulation |
| Doxycycline | 18–22 | Long; once‑daily; safe in renal impairment |
| Metformin | 6 | Intermediate; twice‑daily; risk of lactic acidosis in renal failure |
| Diazepam | 20–50 | Long; accumulates with repeated dosing; active metabolites prolong effect |
| Warfarin | 36–42 | Long; requires careful INR monitoring; numerous drug interactions |
| Digoxin | 36 | Long; narrow therapeutic index; TDM essential |
| Fluoxetine | 48–96 | Very long; slow washout (weeks) when switching antidepressants |
| Phenytoin | 22 (dose‑dependent) | Saturable kinetics; t½ increases with dose; TDM critical |
| Lithium | 24 | Long; narrow therapeutic range; renal excretion; TDM required |
11. Half‑Life in Special Populations
11.1 Kidney Disease
Renal impairment prolongs the t½ of drugs that are primarily excreted unchanged. For example, gentamicin t½ increases from 2–3 h to ≥ 10 h in severe renal failure (CrCl < 10 mL/min). Dose adjustments (extended intervals or reduced doses) are essential. The Cockcroft‑Gault equation is commonly used to estimate creatinine clearance and guide dosing. Drugs like vancomycin, digoxin, and lithium require meticulous TDM in this population.
11.2 Liver Disease
Hepatic dysfunction reduces metabolism, prolonging t½ of drugs like diazepam, morphine, propranolol, and warfarin. In cirrhosis, the t½ of diazepam can exceed 100 hours, requiring substantial dose reduction. The Child‑Pugh score is used to stratify hepatic impairment and guide dosing. Drugs with high hepatic extraction (e.g., propranolol, verapamil) are more affected because clearance depends on liver blood flow.
11.3 Older Adults
Age‑related decline in renal function (GFR drops ~1 mL/min/year after age 40), hepatic blood flow, and lean body mass increases t½ by 50–75% for many drugs. This explains the heightened sensitivity to medications like benzodiazepines (diazepam), opioids (morphine), and warfarin in the elderly. Starting low and going slow is the cardinal rule for geriatric prescribing.
11.4 Children and Neonates
Neonates have immature organ function (low GFR, limited hepatic enzyme activity) and prolonged t½ for many drugs (e.g., theophylline t½ can be 24–36 h in newborns vs. 8 h in children). Clearance increases during infancy and childhood, often requiring higher weight‑based doses than adults. However, renal function matures rapidly, and by 6–12 months of age, many drugs have similar t½ to adults on a per‑kg basis.
11.5 Pregnancy
Increased plasma volume (up to 50%), renal blood flow, and altered enzyme activity (e.g., increased CYP3A4 and CYP2D6) can shorten or prolong t½. For example, the t½ of some anticonvulsants (lamotrigine) decreases significantly during pregnancy, requiring dose increases to maintain therapeutic levels, with a return to pre‑pregnancy doses postpartum.
12. Half‑Life in Drug Discovery and Development
In preclinical and clinical drug development, half‑life is a key parameter that influences the viability of a drug candidate. Medicinal chemists aim for a half‑life that allows once‑ or twice‑daily dosing to improve patient adherence. A half‑life that is too short (e.g., < 2 h) may require extended‑release formulations or frequent dosing; a half‑life that is too long (e.g., > 100 h) may lead to prolonged adverse effects and slow washout in case of toxicity. During Phase I trials, half‑life is determined from plasma concentration‑time curves, and this data is used to design Phase II and III dosing regimens.
13. Clinical Case Studies
📋 Case 1: Gentamicin in Renal Impairment
Presentation: 65‑year‑old male with sepsis, CrCl = 30 mL/min. Normal gentamicin t½ = 2–3 h; with this CrCl, t½ ≈ 10 h.
Action: Extend dosing interval from 8 h to 24–48 h, monitor trough and peak levels to avoid nephrotoxicity and ototoxicity.
📋 Case 2: Digoxin Toxicity
Presentation: 80‑year‑old female with heart failure and renal impairment, on digoxin 0.25 mg daily for 3 weeks. Nausea, visual disturbances (yellow halos), bradycardia. Digoxin t½ prolonged from 36 h to ~5 days due to renal failure.
Action: Hold digoxin, measure serum level (likely > 2.0 ng/mL), administer digoxin immune Fab if severe, reduce maintenance dose based on renal function.
📋 Case 3: Theophylline Overdose
Presentation: Patient with theophylline level 53 μg/mL (therapeutic 10–20); t½ = 8 h (normal).
Question: How long to fall to 20 μg/mL?
Answer: 53 → 26.5 (1 t½) → 13.25 (2 t½). To reach 20 takes about 1.4 half‑lives ≈ 11 h. Monitor, treat seizures/arrhythmias, consider charcoal haemoperfusion if severe.
📋 Case 4: Phenytoin Toxicity in Saturable Kinetics
Presentation: A patient on phenytoin 300 mg daily for epilepsy develops nystagmus and ataxia. Serum phenytoin level is 32 μg/mL (therapeutic 10–20). The dose is reduced to 250 mg daily.
Reasoning: Because phenytoin follows Michaelis‑Menten kinetics, a small dose reduction (50 mg) can lead to a disproportionate drop in concentration (e.g., from 32 to 18 μg/mL) as clearance shifts back to first‑order. TDM is repeated in 1–2 weeks.
14. Therapeutic Drug Monitoring (TDM)
TDM uses drug concentration measurements to individualise therapy. Half‑life guides:
- Sampling times: Trough levels (just before next dose) and peak levels (after infusion). For vancomycin, troughs are drawn 30 min before the fourth dose (after steady state).
- Steady‑state timing: Samples should be drawn after 4–5 t½ to reflect steady state. For digoxin (t½ 36 h), this is about 7 days.
- Dose adjustments: If level is too high, increase interval (if t½ long) or reduce dose; if too low, shorten interval or increase dose.
Drugs commonly monitored include aminoglycosides, vancomycin, digoxin, theophylline, phenytoin, cyclosporine, and lithium. TDM is particularly valuable in patients with altered physiology (renal/hepatic impairment, elderly, children) and those on interacting medications.
Q1: How many half‑lives are needed to eliminate a drug?
Q2: Does a longer half‑life mean a stronger medicine?
Q3: Why do some drugs need to be taken several times a day?
Q4: Can kidney disease increase drug half‑life?
Q5: Is half‑life the same for everyone?
Q6: What is the difference between half‑life and duration of action?
Q7: How does half‑life affect steady‑state concentration?
Q8: What happens if a loading dose is not given?
Q9: Can alcohol affect drug half‑life?
Q10: What is the clinical significance of half‑life in overdose?
Q11: What is the terminal half‑life and why is it important?
Q12: How do protein binding and Vd affect half‑life?
Q13: What is the relationship between half‑life and AUC (area under the curve)?
Q14: Why is the half‑life of warfarin so variable?
Q15: How do clinicians use half‑life to switch antidepressants?
16. Key Takeaways
- Definition: t½ is the time for drug concentration to fall by 50%.
- Formula: t½ = 0.693 × Vd / Cl (first‑order kinetics only).
- Steady state: Reached after 4–5 half‑lives; time to 90% = 3.3 t½.
- Elimination: >96% eliminated after 5 half‑lives.
- Loading dose: Used to rapidly achieve target concentration; MD maintains it.
- Factors: Age, renal/hepatic function, genetics, body composition, drug interactions, disease states.
- Aging: t½ is 50–75% longer in elderly for many drugs.
- Saturable kinetics: For drugs like phenytoin, t½ is dose‑dependent; small dose changes can have major effects.
- Clinical use: Guides dosing, TDM, toxicity prevention, and dose adjustments in organ dysfunction and special populations.
17. References and Suggested Readings
1. Rowland M, Tozer TN. Clinical Pharmacokinetics and Pharmacodynamics: Concepts and Applications. 4th ed. Lippincott Williams & Wilkins; 2011.
2. Birkett DJ. Pharmacokinetics Made Easy. 2nd ed. McGraw-Hill; 2010.
3. Buxton ILO, Benet LZ. Pharmacokinetics: The Dynamics of Drug Absorption, Distribution, Metabolism, and Elimination. In: Brunton LL, Hilal-Dandan R, Knollmann BC, eds. Goodman & Gilman’s The Pharmacological Basis of Therapeutics. 13th ed. McGraw-Hill; 2018.
4. Meibohm B, Derendorf H. Basic concepts of pharmacokinetic/pharmacodynamic (PK/PD) modelling. Int J Clin Pharmacol Ther. 1997;35(10):401-13.
5. Leucuta SE, Vlase L. Pharmacokinetics and metabolic drug interactions. Curr Clin Pharmacol. 2006;1(1):5-20.
6. Mangoni AA, Jackson SHD. Age‑related changes in pharmacokinetics and pharmacodynamics: basic principles and practical applications. Br J Clin Pharmacol. 2004;57(1):6-14.
7. Verbeeck RK, Musuamba FT. Pharmacokinetics and dosage adjustment in patients with renal dysfunction. Eur J Clin Pharmacol. 2009;65(8):757-73.
8. Westfall TC, Macarthur H, Westfall DP. Neurotransmission: The Autonomic and Somatic Motor Nervous Systems. In: Brunton LL, Hilal-Dandan R, Knollmann BC, eds. Goodman & Gilman’s The Pharmacological Basis of Therapeutics. 13th ed. McGraw-Hill; 2018.
9. US Food and Drug Administration. Guidance for Industry: Population Pharmacokinetics. 2022.
10. National Institute for Health and Care Excellence (NICE). Medicines optimisation: the safe and effective use of medicines to enable the best possible outcomes. NICE guideline NG5; 2015.
11. Winter ME. Basic Clinical Pharmacokinetics. 5th ed. Lippincott Williams & Wilkins; 2010.
12. Bauer LA. Applied Clinical Pharmacokinetics. 3rd ed. McGraw-Hill; 2014.
This educational resource is intended for medical students and healthcare professionals to enhance understanding of pharmacokinetics. It is not a substitute for clinical judgment, individual patient assessment, or up‑to‑date prescribing information. Always consult current guidelines, local formularies, and a qualified healthcare provider before making therapeutic decisions.Last Updated: June 2026 | Version: 2.0 | Review Frequency: Annual review recommended
This article has been written with a focus on evidence‑based medicine, clinical pharmacology, and practical application for medical students, residents, and practicing clinicians. The content aligns with contemporary pharmacokinetic principles and antimicrobial stewardship practices.




10 Comments